new
improved
Major Market Share update
The spring brought a major update of the Market Share report as we wanted to provide an even clear image of your business's presence in SERP and how it performs in comparison with your niche competitors. You can now:
1)
Ignore irrelevant websites and focus only on competitors in your business's niche
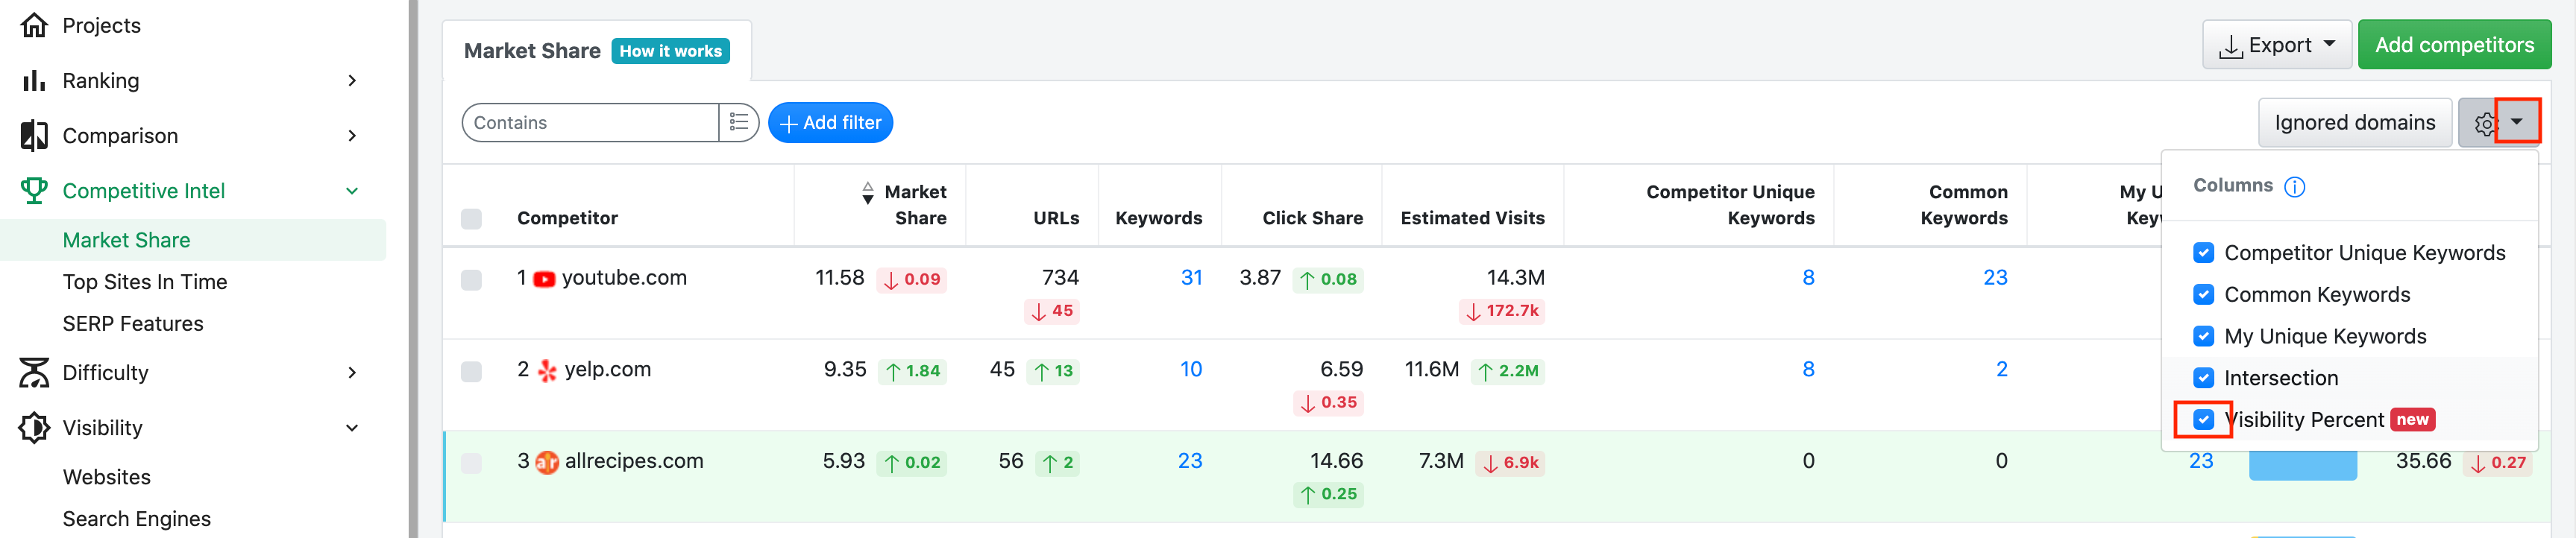
The
Hide domains
option was revamped to Ignore domains
. Previously, when hiding a domain, that competitor it was only removed from the UI (it no longer appeared in the Market Share report) but it was not excluded when computing the Market Share value for the Top 20 ranking domains.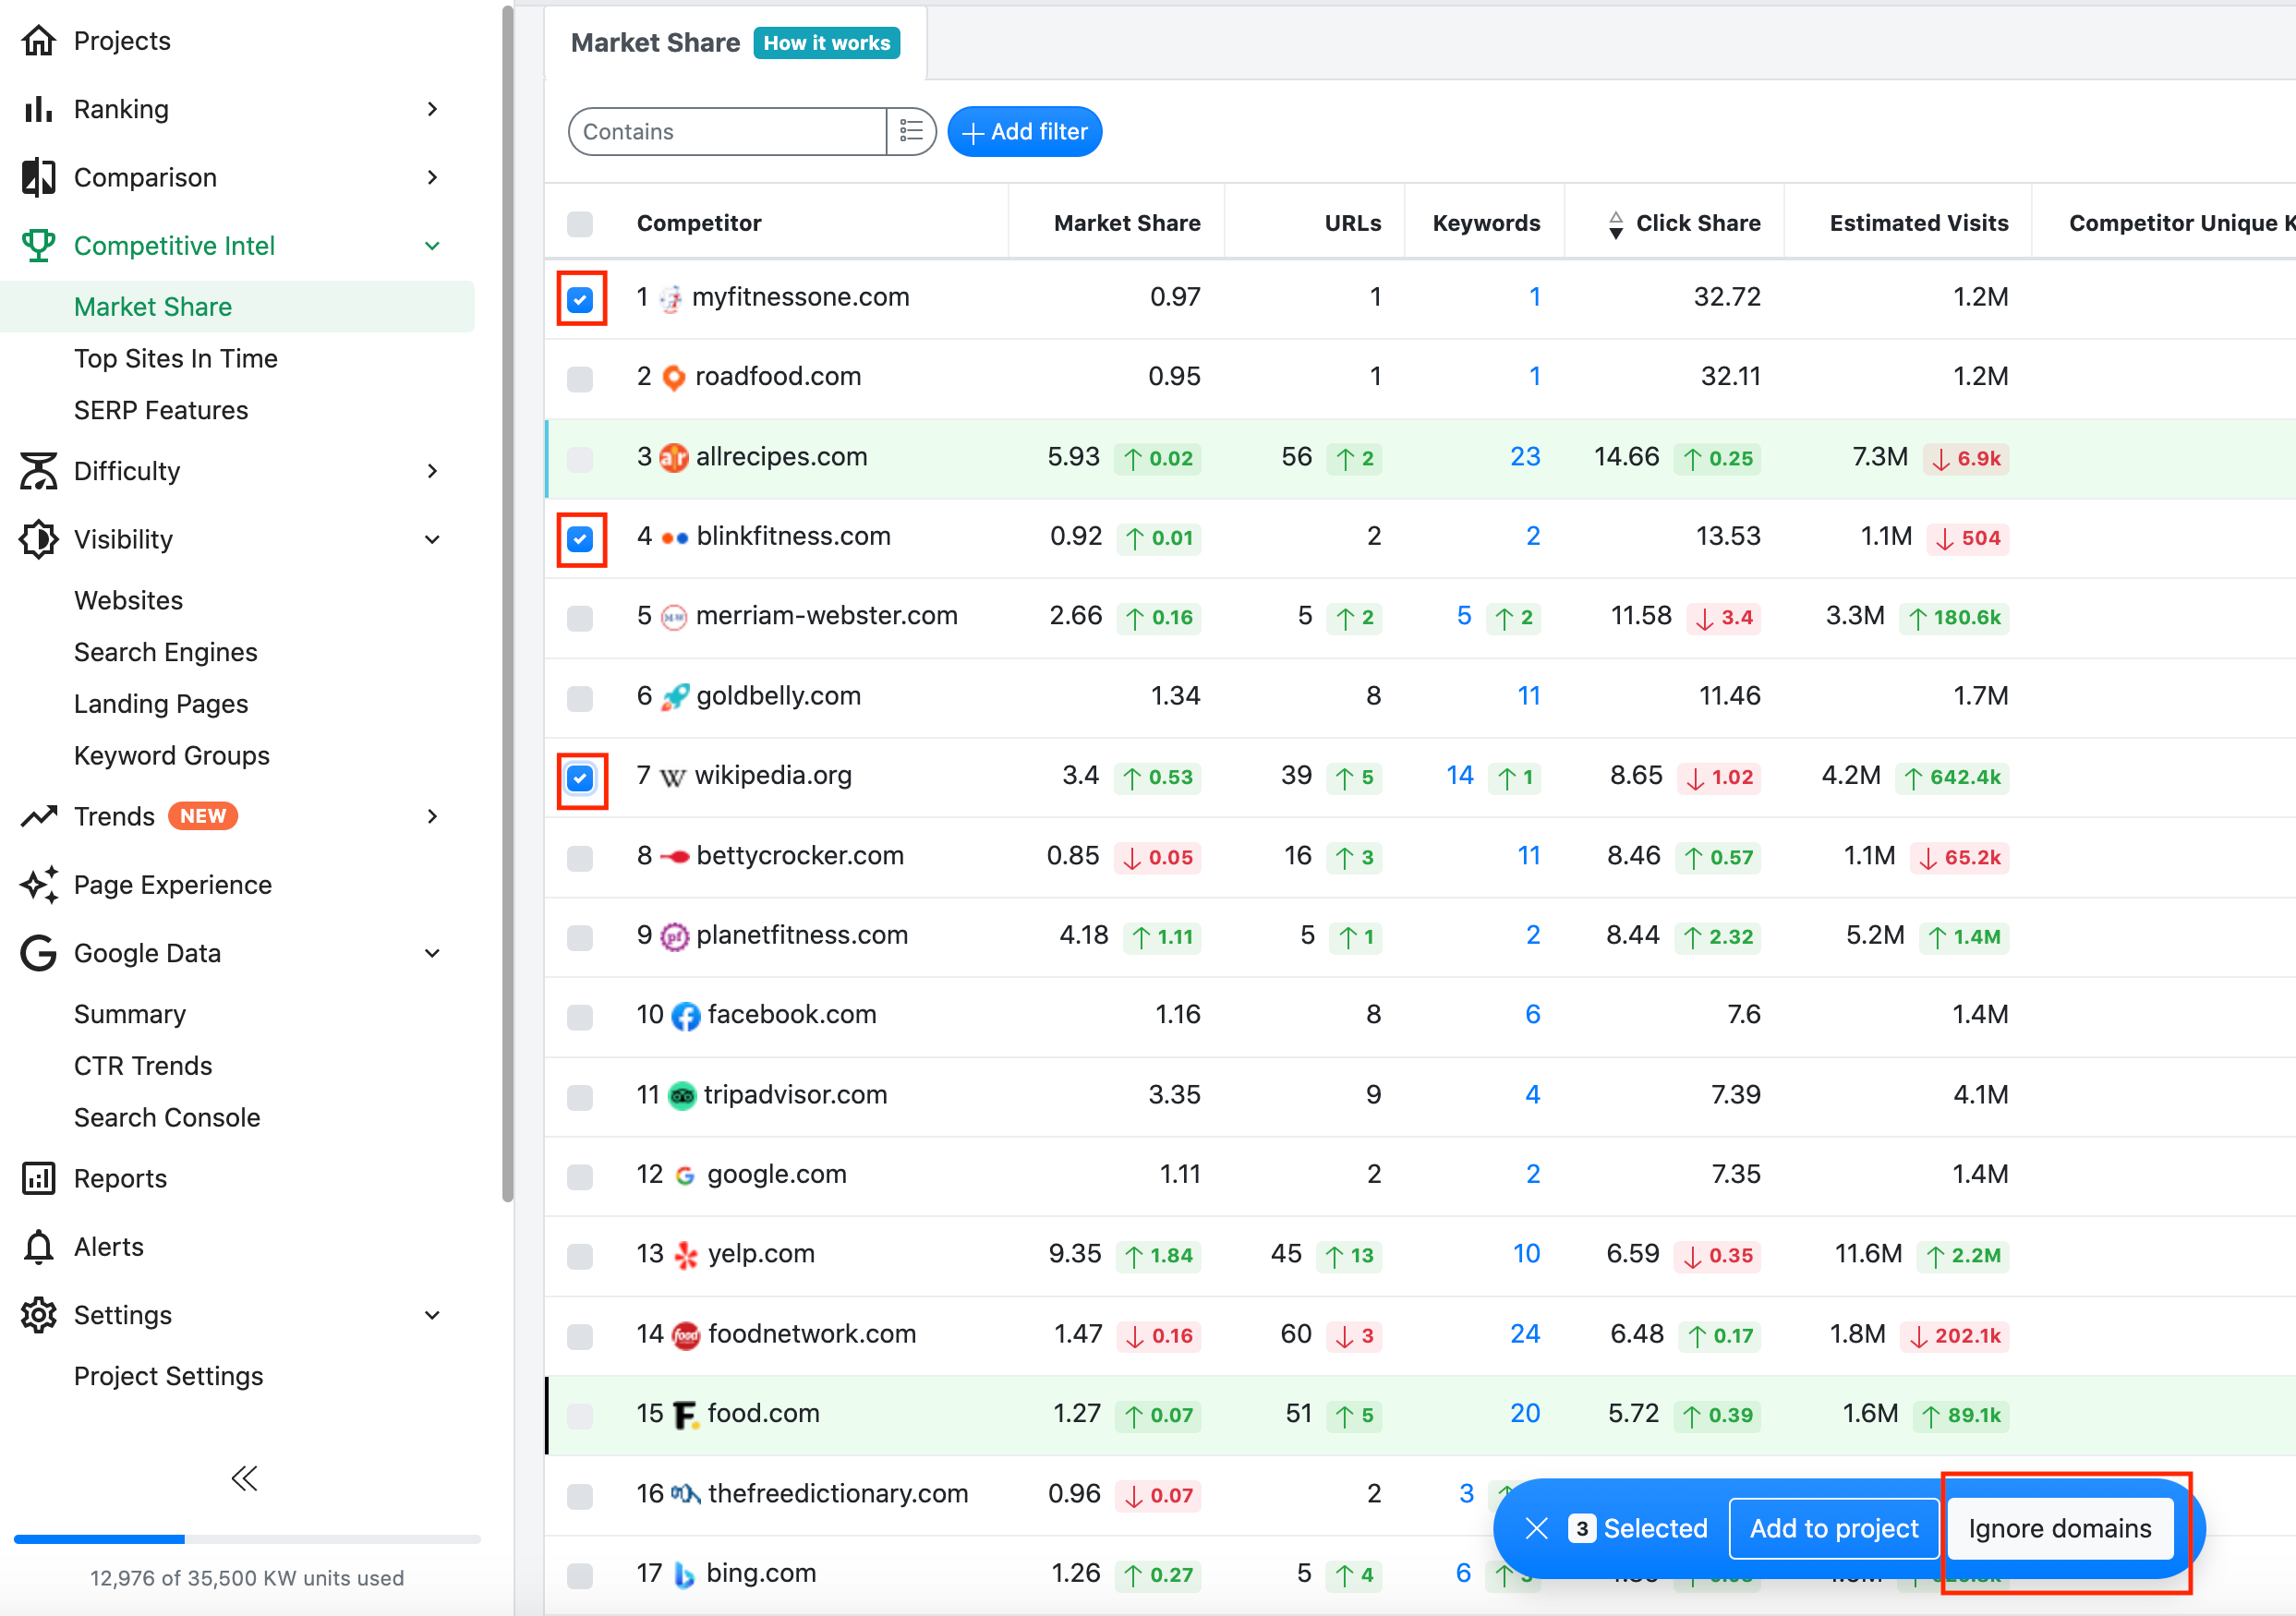
Now, when ignoring a domain, that competitor will not only be removed from the UI but will also be completely excluded when building the Top 20 competitors list and Market Share value.
One can now focus more on direct competitors and less on irrelevant domains (such as Wikipedia or Facebook) which are not related to your business's niche but occupy the first positions in SERP due to domain popularity.
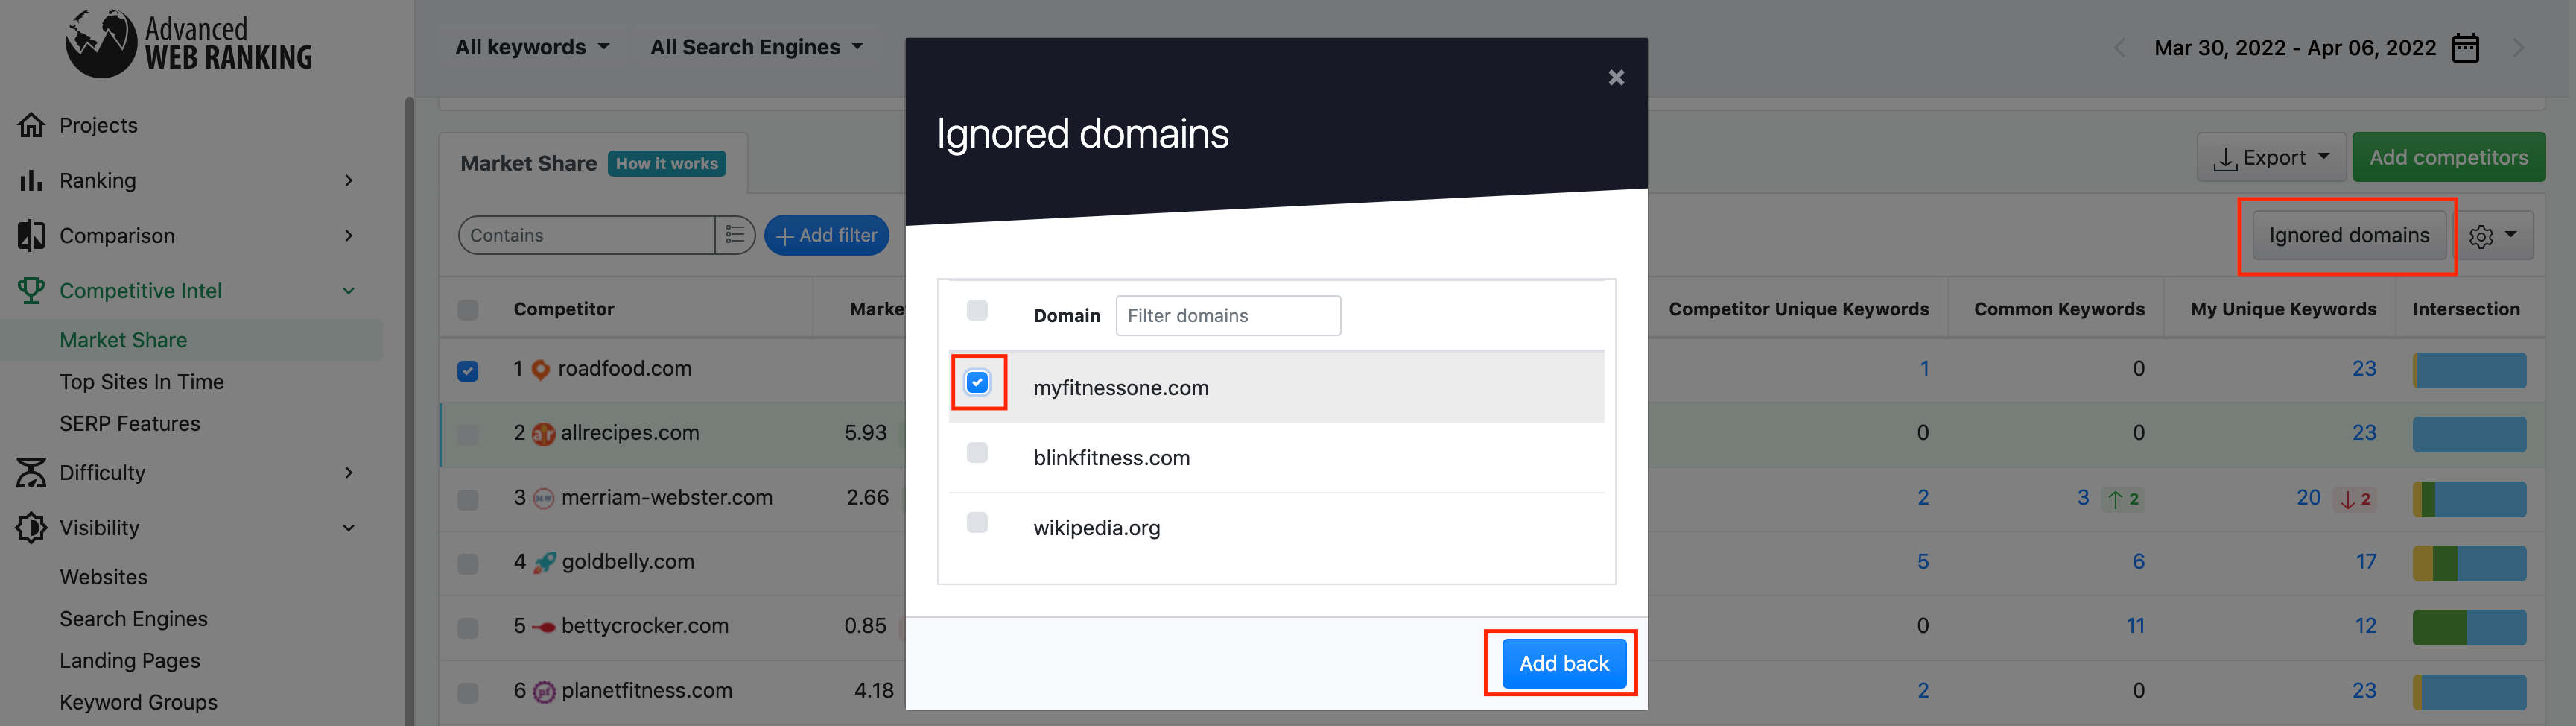
Starting with the following ranking update, the ignored domains will be excluded and the next in line competitors will be automatically added to the Market Share report to fill in the list of websites occupying the Top 20 positions.
The action of ignoring domains can be undone at any point by adding the excluded websites back to the project.
2)
Visualize the Visibility Percent of the Top 20 ranking websites
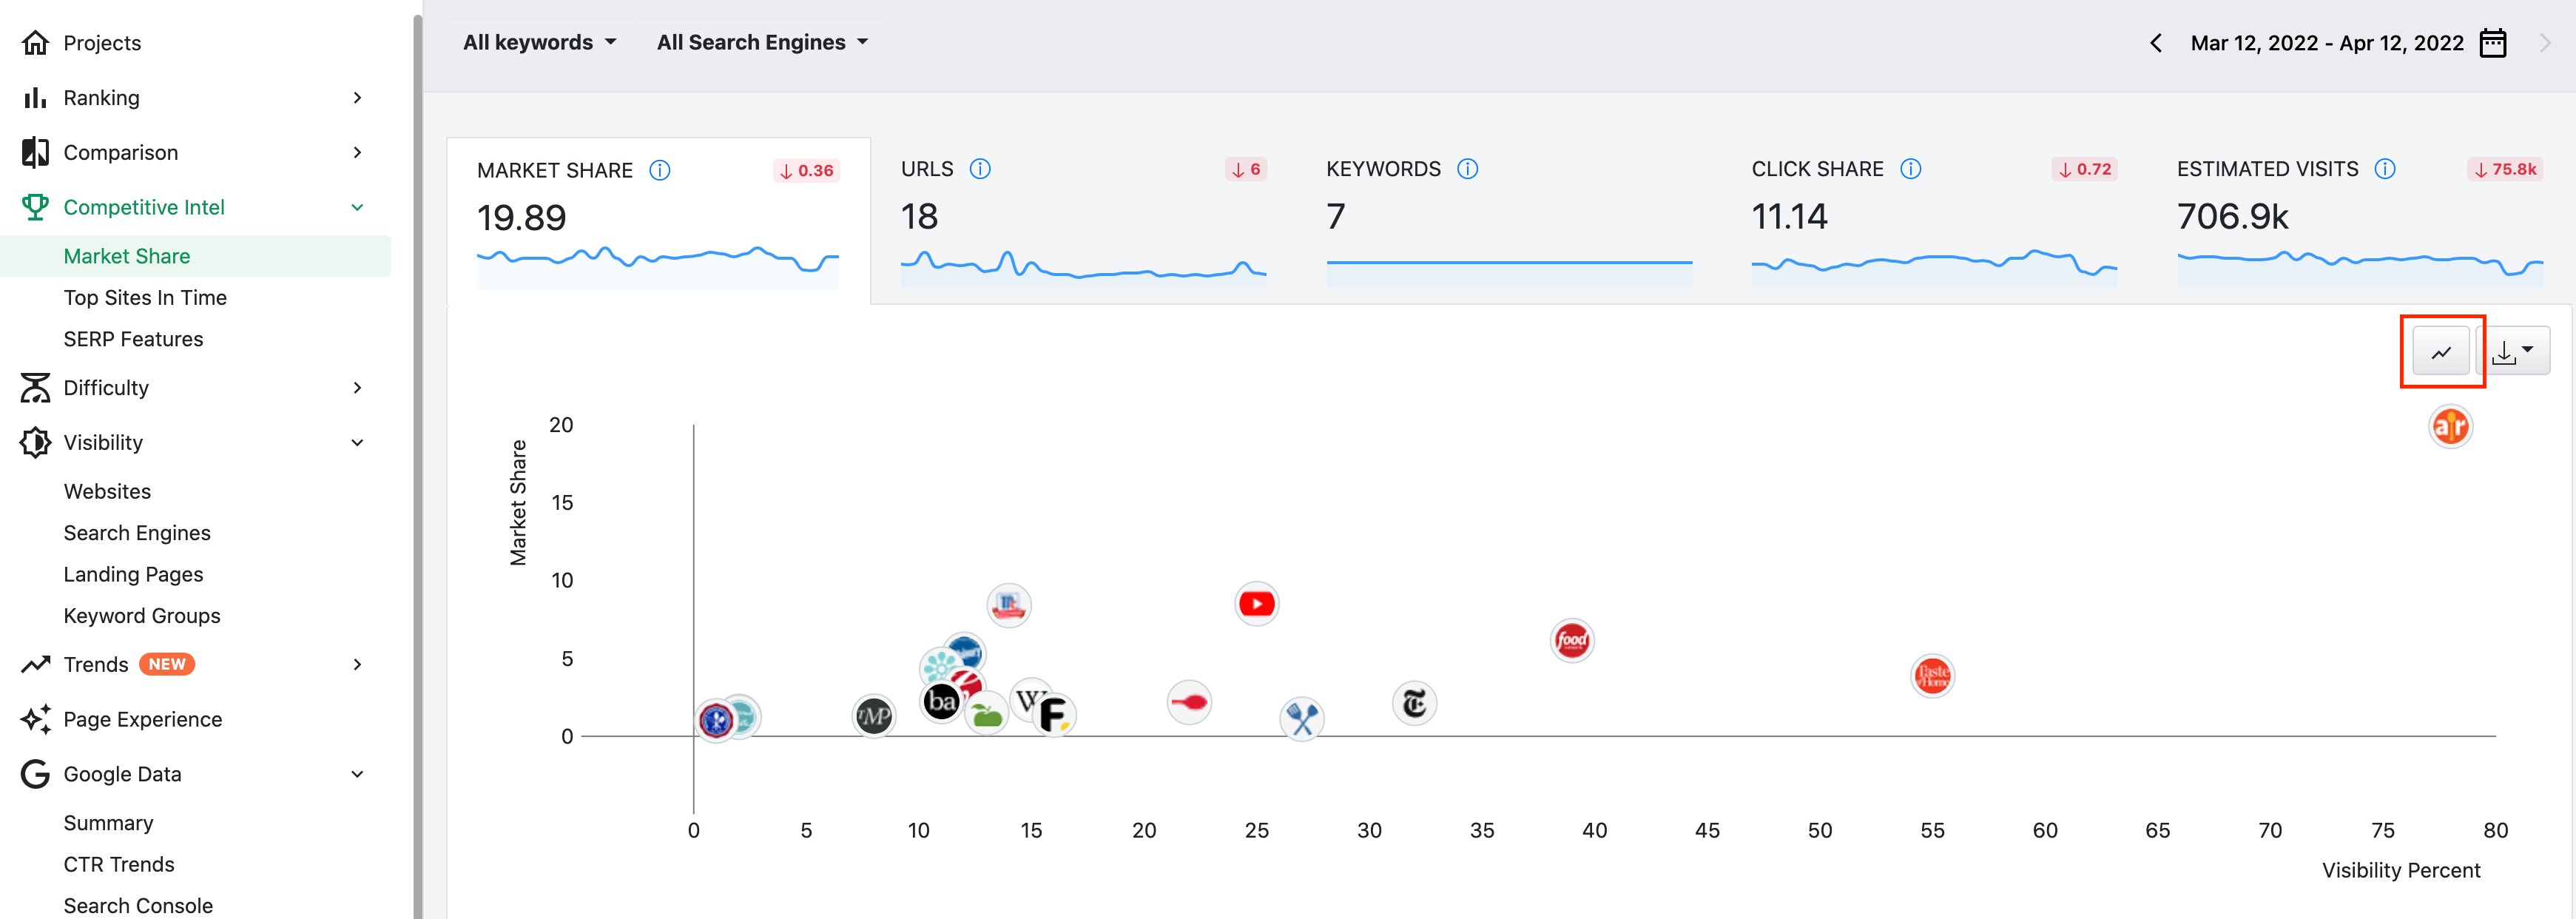
After the update, the Visibility Percent performance metric was added also to the Market Share report. Seeing the Visibility Percent alongside the Market Share of Top 20 domains is helpful in determining which domains are indeed owning higher ranking positions, not just a better share of market for keywords with higher search volumes.
3)
Easily compare the Market Share with other Visibility metrics via the updated chart
The Market Share chart is now even more useful for competition analysis as it allows one to visualize the Market Share and another key performance indicator simultaneously.
By default, the chart displays the
Market Share
and the Visibility Percent
but you can simply switch to a different combination by using the KPI tabs at the top. For instance, by clicking on the Estimated Visits
tab, you can see the competitors that are likely to get a higher number of visits for the Top 20 ranking keywords.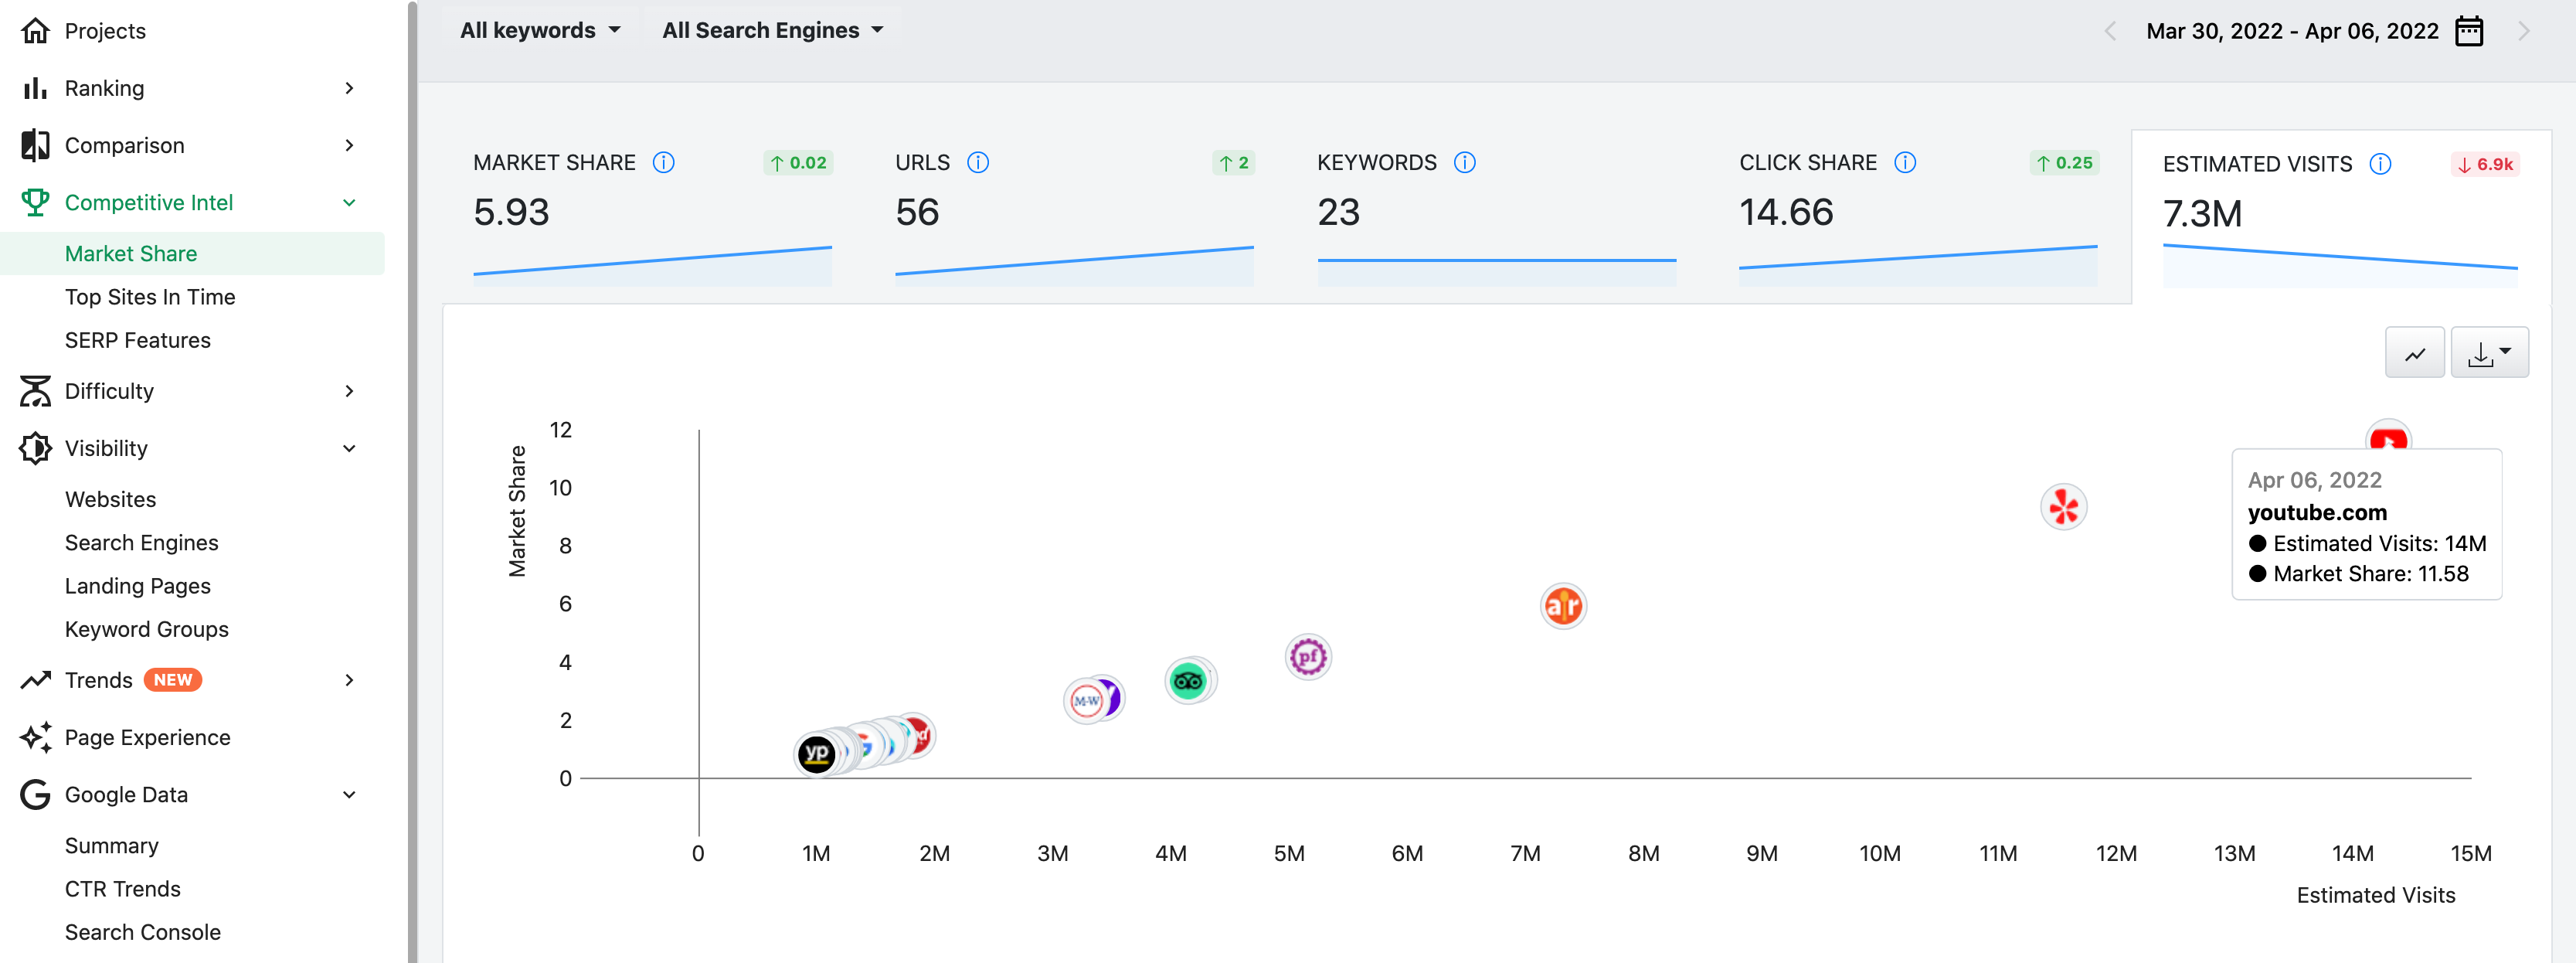
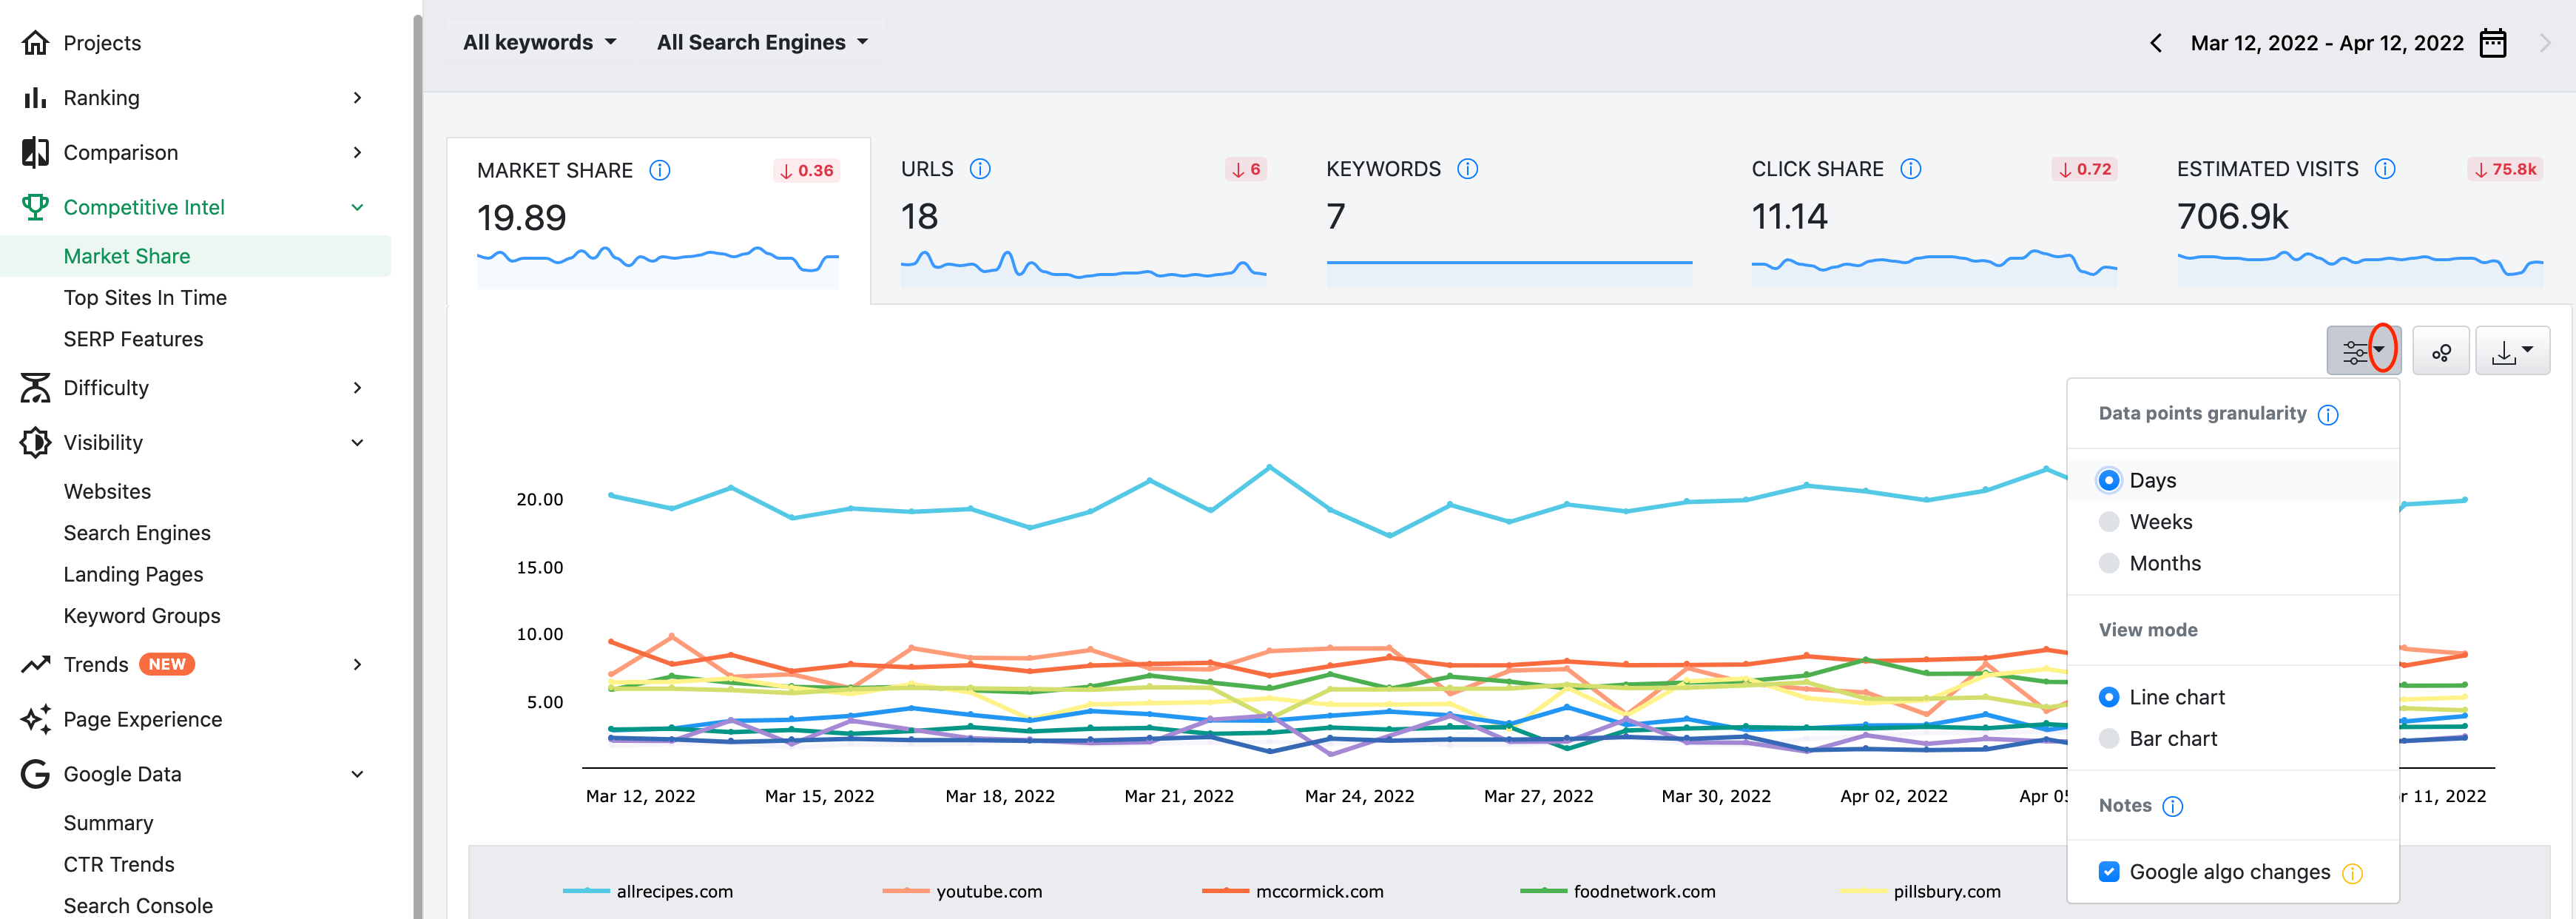
The chart's old visualization mode - which allows seeing the trend of the selected KPI across the applied date range - is still available. The chart's display mode can be simply changed using the dedicated switch button: